Difference between COVID-19 Recession and the Great Recession of 2008
Friday, July 17, 2020
The Great Recession of 2008 was brought about by the collapse of the housing market which led to decreases in industrial production and truckload volume. Despite all of this, the United States still had an inflationary market. The opposite is true of our current market and the reasons are as follows:
1. Fuel is not subject to inflation like most other products and services
In 2007-2008, the spike in fuel rose much faster than truckload (TL )rates which led to a decline in overall carrier capacity. The lack of carrier capacity made up for the volume decline. However during 2020 fuel prices went down to historic lows.
2. The unprecedented nature of COVID-19 recession
Shelter in place laws and shutdowns of various industrial sectors have caused a fast and steep economic decline. The shock to the market happened much faster than in the Great Recession of 2008.
Consumer spending is still relatively sturdy given the unemployment percentages, and consumer confidence somewhat rebounded in June. Another difference in this constricting environment is that truckload shipment volumes will likely remain higher than expected for some time. In April volumes fell to holiday levels due to lockdowns across the country.
The reefer market continues to be strong for carriers due to seasonal fruit season. Spot reefer volumes rose 4.5% from May to June.
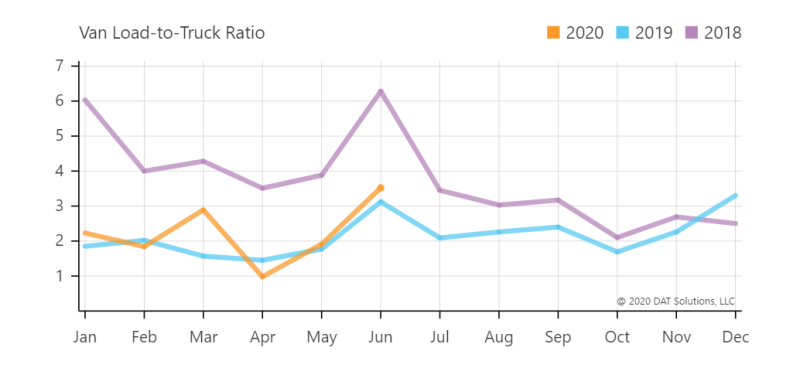
Based on the data DAT provided for June. The load-to-truck ratio doubled to 3.5 for vans, making this the second month in a row. In summary, there is more freight than trucks which leads to an increase in rates.
DAT Chief of Analytics Ken Adamo explained that June was a normal season pattern for truckload freight volume especially with the unpredictability of the preceding months of March through May. “The month did fall in line with our forecasts and expectations,” he said. “We’re seeing dry van spot rates above $1.80 a mile, excluding fuel surcharges, which is around 10 cents higher than the same period in 2017 and 2019. For refrigerated freight, with the exception of the capacity-constrained 2018 freight market, the national average reefer rate ended June at its highest monthly average since 2015. Better rates are good news for carriers but the broader storyline is that June provided some much-needed stability for truckload markets.”
We have been through recessions, hardships, and economic uncertainty during both 2008 and 2020. Freight volumes are directly related to consumer confidence. The fears that go along with COVID-19 have directly altered consumer spending, however we have not felt the full effect yet. In order for the transportation industry not to decline, job security needs to be restored and expendable cash needs to be injected back into the economy.
Sources:
- Solutions, DAT. “Capacity Tightens Ahead of Inspection Blitz.” DAT, 2020, www.dat.com/industry-trends/trendlines.
- Holm, Seth, and Stephen Webster. “Volumes up 45% Year-over-Year This Week (Yes, 45%).” FreightWaves, 3 July 2020, www.freightwaves.com/news/volumes-up-45-year-over-year-this-week-yes-45.
- Holm, Seth. “Volumes Fall Post-July Fourth (as Expected) but Remain Strong.” FreightWaves, 10 July 2020, www.freightwaves.com/news/volumes-fall-post-july-4-as-expected-but-remain-strong.
- Pickett, Chris. “Q2 2020 Coyote Curve Market Guide: Key Takeaways from Our Live Panel.” Q2 2020 U.S. Truckload Market Update & Forecast, 16 July 2020, resources.coyote.com/source/us-truckload-market-guide.
